Tracking Briz-M on 18
November 2007
Sven Grahn
- First
reception, on 1020.5 MHz, 0233-0239.51 UT
- Second
reception, on 1018.5 MHz, 0240.20-0246.54 UT
- Third
reception, on 1020.5 MHz, 0248.50-0258.20 UT
- Single-carrier
mode splits to dual-carrier mode at command-off at 0258.20 UT
- Fourth
and fifth receptions, on 1020.5 MHz, 0712-0741.14 UT
- Sixth
reception, on 1020.5 MHz, 0750.20-0754.41 UT
- Post-Script on spectrum
inversion
I watched the launch of the Proton carrying the Swedish Sirius-4
satellite (built by Lockheed-Martin) from Baikonur at ILS' website at
2239.47 UT. Then went to bed and
set the alarm clock for 0225 UT. I had set up the radio to use my 900-1000
MHz helix that points at low elevation low towards the southeast. As a
preamp I had connected the SSB Electronic amplifier for 1000 MHz I had
used in 2006 to track Molniya satellites.

I
was monitoring 1020.5 and
1018.5 MHz as per data in the Proton user's manual available online. he
relevant page is reproduced below.
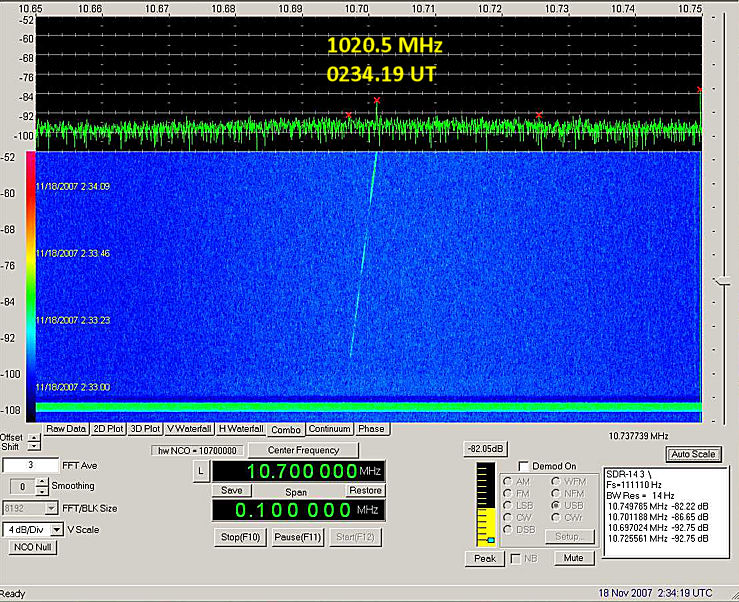
First
reception, on 1020.5 MHz, 0233-0239.51 UT
I must say I expected maybe a
weak diffuse wideband bump on the screen. Nothing had prepared me for
what happened. The alrm clock was set at 0227 UT. I was flipping back
and forth between frequencies on the
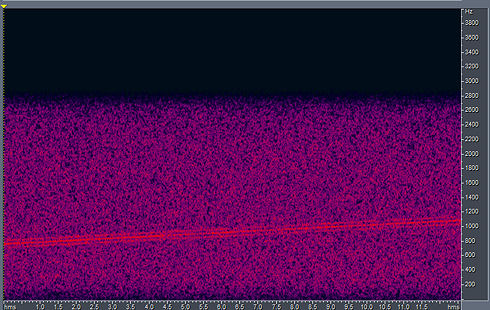
AR 8600 and then, at 0233 UT, I saw the strong carrier on 1020.5 MHz,
with a fast rising doppler! The C/N shot up to 16 dB. It faded in and
out and then
just vanished at 0239.51 UT. The waterfall display shows the
fading signal and rising Doppler during this first reception of the
signal.
Second reception, on
1018.5 MHz, 0240.20-0246.54 UT
I retuned to 1018.5 MHz and
first saw a single carrier at 0240.20 UT, soon replaced by two carriers
+/- 6 kHz from the centre. I now turned on the demodulator and heard
audible modulation using USB. Sort of a purring sound. Doppler was
still rising. Then the signal vanished again at 0246.54 UT.
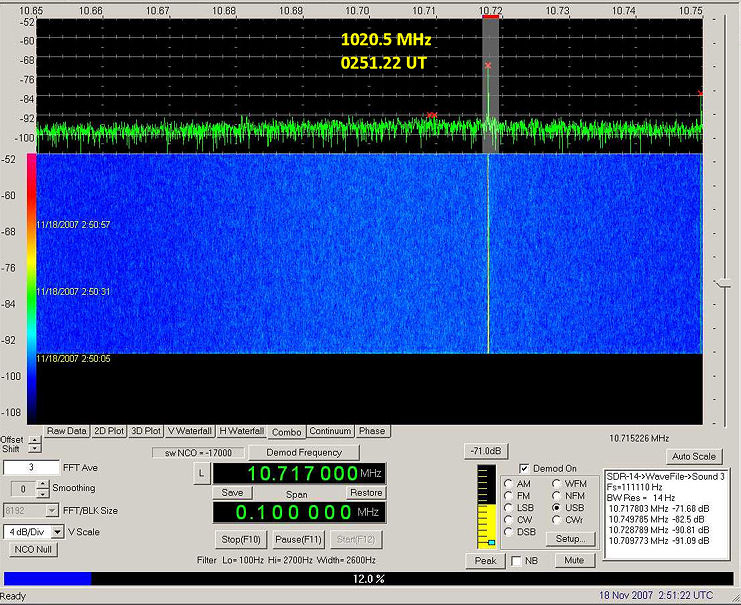
The spectrum from my Adobe Audition
software shows what the demodulated (Upper SideBand) looks like. By
clicking here
you can hear a short piece of the signal.
Third
reception, on 1020.5 MHz, 0248.50-0258.20 UT
I found the signal again on
1020.5 MHz at 0248.50 UT. Again the signal was a strong, very strong
carrier with audible modulation, but the modulation was different, a
pulse train... C/N increased to 24 dB! The doppler rate was now slowing
down and the doppler maximum was reached at about 0252 UT. I then
started taking down frequencies by hand:
1020.517667 MHz at 0253.30 UT
1020.517633 MHz at 0253.42 UT
1020.517545 MHz at 0254.56 UT
1020.517409 MHz at 0256.04 UT
1020.517274 MHz at 0257.13 UT
The waterfall picture below shows that the
signal was quite strong during this reception.
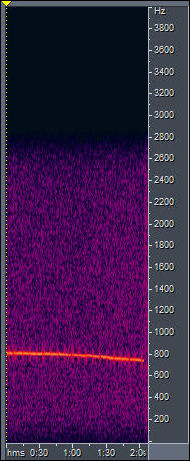
Here is what the signal on 1020.5 MHz
looks like in overview. It seems that there is some kind of frame
marker every 6.6 seconds.
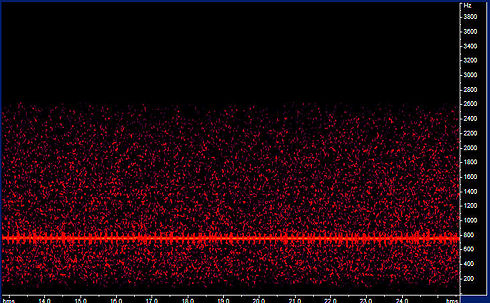
On the smallest scale the signal
looks like below. By clicking here you can
hear a short segment of this signal.
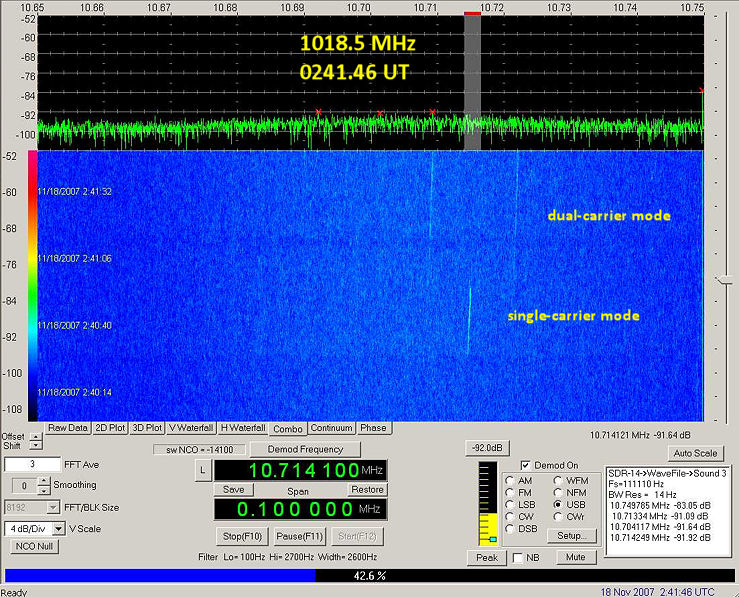
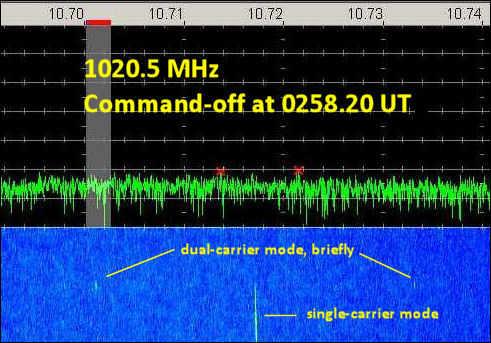
Single-carrier
mode splits to dual-carrier mode at command-off at 0258.20 UT
The signal was commanded off
at approximately 0258.20 UT. Just before the signal vanished the single
carrier on 1020.5 MHz had split into two carriers similar to what I had
seen on 1018.5 MHz. However, the carriers were now at +/- 16 kHz
instead of +/- 6 kHz apart as on 1018.5 MHz. The waterfall picture
below shows it clearly.
After this I set the waterfall display to
one update every 60 seconds and the AR 8600 receiver to 1020.5 MHz. The
Briz-M now climbed towards apogee at 35800 km where rocket engines
would start again and then the Sirius-4 satellite would be separated.
It is a bit funny that I saw a doppler maximum. If one runs an orbit
simulation a doppler minimum would be expected- The time of the minimum
is 0249 UT, which agrees well with the maximum! Often one can see
reverse doppler on the SDR-14 display. A strong signal just outside the
range of the screen "folds back" into the display.
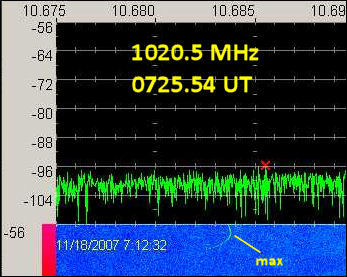
Fourth
and fifth receptions, on 1020.5 MHz, at 0400-0430 UT and
0700-0741.14 UT
When I woke up again just
after 8.20 local time I rushed out of bed to look at the waterfall that
has been running on slow scroll throughout the morning hours. It was
immediately obvious that the signal on 1020.5 MHz had come up again at
about 0700 UT (the time stamp on the SDR-14 screen is such that the top
of the lettering corresponds to the actual time). Again two carriers (I
have measured them to be at
exactly +/- 16 kHz apart). I could see the doppler maximum a few
minutes before 0725. The signal level increased after the
maximum had been reached. Just a few minutes later the frequency
curve did not
turn so sharply down, it sort of distinctly leveled out. Unfortunately
I fumbled and lost the spectrogram where one can see this. However, the
piece of the waterfall below shows the lower of the two carriers and
a clear maximum. The orbit simulation shows no maximum. Why is there a
maximum?
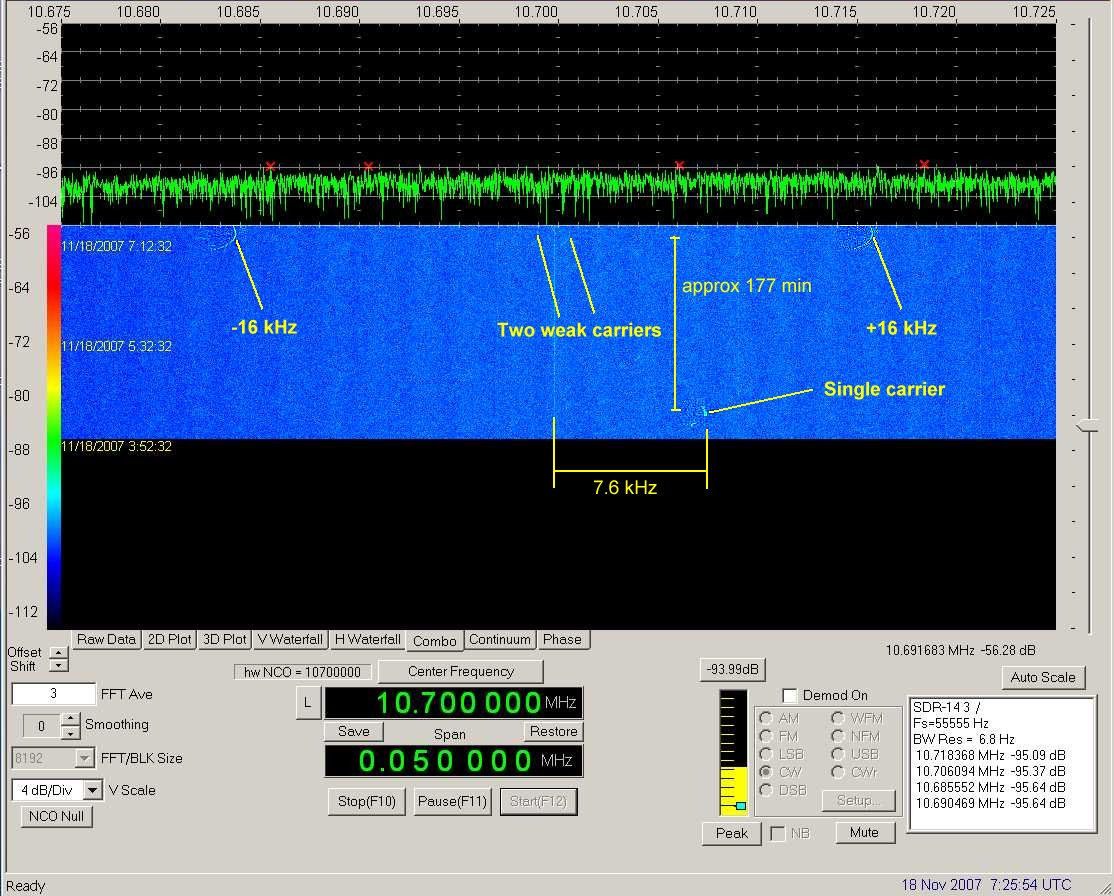
Possibly because of transmitter drift.
Indeed, there is actually another single-carrier trace with a maximum
on the overnight
waterfall at about 0400-0430 UT. If one compares the frequency at the
0415 UT maximum with that of the the frequency precisely between the
dual-carrier maxima at 0712 UT the frequency has drifted down 7.6 kHz.
Since the display is frequency-inverted there is actually an increase
in frequency of 7.6 kHz. Whe running simulations using the
pre-launch orbit data from ILS and element sets from SpaceTrack the
frequency increase is estimated at 7.6 kHz - the same number. I
promise, I measured the frequency shift before computing. it. The
figure below shows the entire waterfall that I saw when waking up.
It is instructive to compare the
little maxima at 0415 and 0712 UT. It appears that there were
"dropouts" in the signal with its maximum frequency at 0415 UT. However
the shape of the "maxima" are the same. See picture below:
1020.515147
at 0739.06
1020.515113 at 0740.10, i.e. -34
Hz/64 sec = -0.53 Hz/s, or actually +0.53 Hz/s because of the spectrum
inversion
1020.515106 at 0740.36, i.e - 7
Hz/16 sec = -0.44 Hz/s, or actually +0.44 Hz/s because of the
spectrum inversion
Orbit
simulations show that the doppler rate was 0.52 Hz/s, a
reasonably good agreement.
I thought that this was the
end and
that the spacecraft had separated from the Briz-M. But I had not
checked flight plan. If I had done that I could have seen that Briz
ignition was planned for 0730.03 UT. This is probably when I saw the
doppler curve level off. Briz burnout was planned for 0737.15 UT. Both
these events occurred within this reception period.
Sixth
reception, on 1020.5 MHz, 0750.20-0754.41 UT
To my surprise the signal (+/-
16 kHz carriers) came back strongly on 1020.5 MHz at 0750.20 UT. There
was almost no doppler shift. Just before LOS I measured the two
carriers to be located at 1020.513 MHz and 1020.481 MHz (the three
decimal beyond these numbers were identical!), so the center fx was
1020.497 MHz. Command-off occurred at 0754.41 UT.
Nominally, spacecraft separation
should have occurred at 0752.47 UT. So, after this reception I did not
hear from Briz-M again.
Post-Script on spectrum
inversion
In December 2007, when
tracking satellites on VHF, I discovered that my receiver, the AR8600,
inverts the internediate frequency output at 10.7 MHz for input
frequencies around 150 MHz. It probably does the same at 1 GHz, while
at S-band it does not. The receiver changes operations mode for various
frequency ranges, so this is a probable explanation to the spectrum
inversion giving me so much headache above.

 Back
to Space Tracking Notes
Back
to Space Tracking Notes