Sven Grahn
The spacecraft was launched from Yasny on a Dnepr rocket at 1442.16 UT on June 15, 2010.
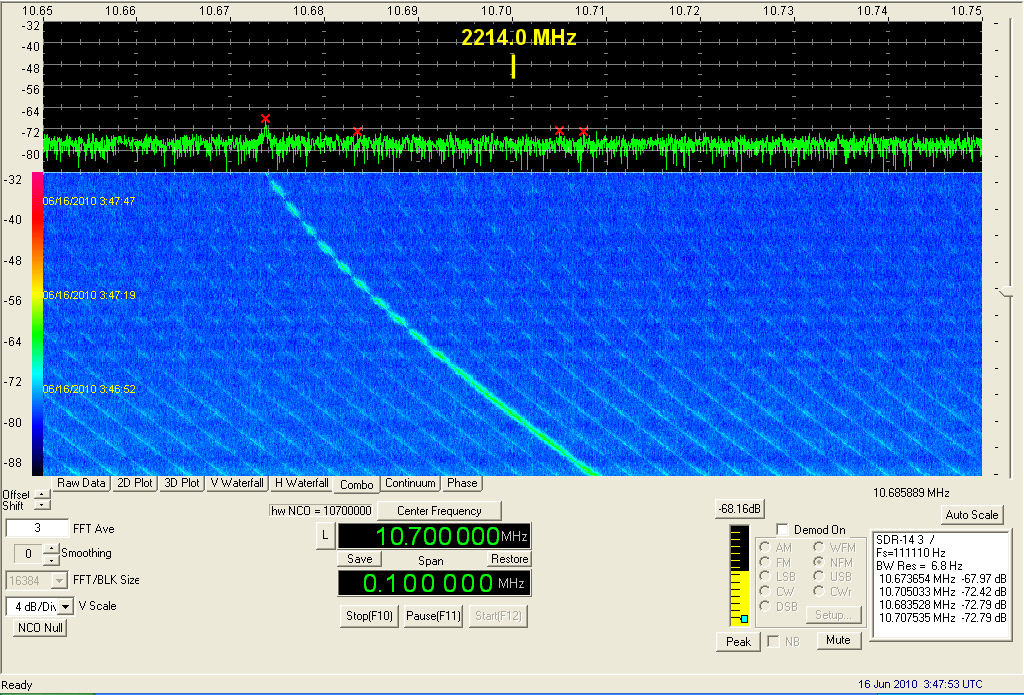
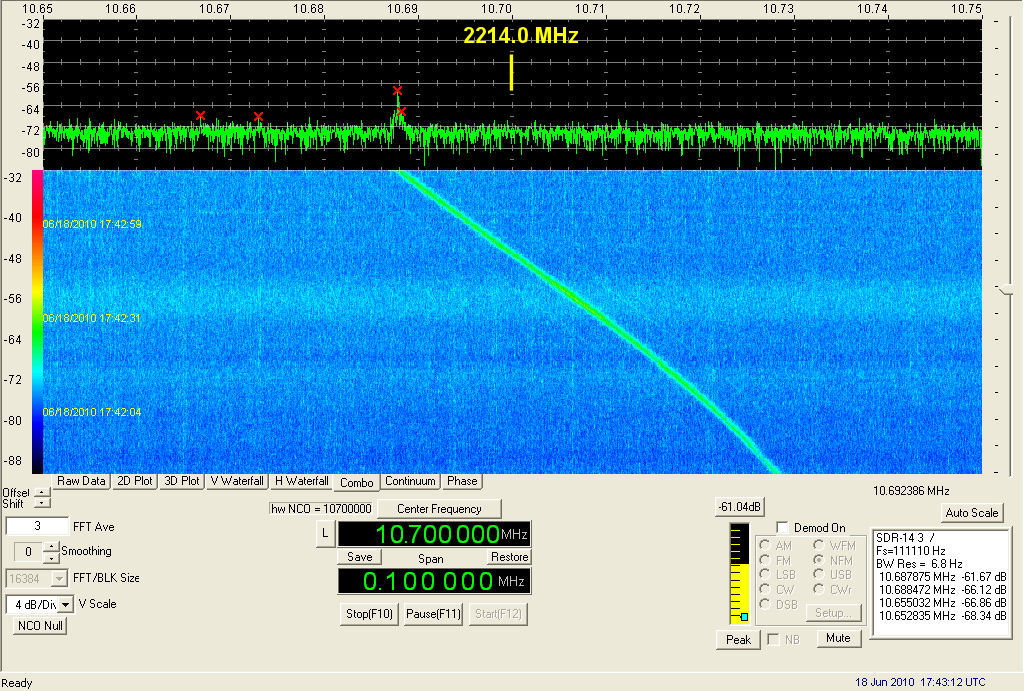
Signals on S-band, 2214.0 MHz, were picked up in Stockholm at 0343.45-0353.18 UT on 16 June 2010. This was an overhead pass in Stockholm (see map below). The receiving setup used is described here.
The waterfall below shows the signal very near closest approach which was at approximately 0346.43 UT, about 90 sec ahead of the time predicted by pre-launch orbital elements. Sideband peaks appear at 4 kHz intervals.

After closest approach distinct variations in signal strength appeared - probably caused by the onboard antenna pattern.
More signals were picked up on a southbound pass near Stockholm at 1720.50-1725.22 UT.
Space Command initially issued two-line element sets for five object, which I have ordered in terms of increasing semi.major axis:
| Catalog number | Object | My ID |
| 36599 | 2010-28B | Gas Dynamic Shield |
| 36601 | 2010-28D | Picard |
| 36598 | 2010-28A | Adapter for Picard |
| 36602 | 2010-28E | Prisma |
| 36600 | 2010-28C | Dnepr 3rd stage |
The identification is made based on the launch vehicle interface control document.
But after two days they changed all this:
| Catalog number | Object | ID |
| 36598 | 2010-28A | Picard |
| 36599 | 2010-28B | Prisma |
| 36600 | 2010-28C | Dnepr 3rd stage |
| 36601 | 2010-28D | Adapter for Picard |
| 36602 | 2010-28E | Gas Dynamic Shield |
The element sets below have been generated by az/el measurements from Esrange and from onboard GPS measurements:
Prisma from
az/el measurements
1 36599U 10028B 10166.62363426 -.00000364
00000-0 -11239-3 0 03
2 36602 98.2888
353.7797 0040488 191.8505 342.2942 14.40916929 00
Prisma GPS rev
6
1 36599U 10028B 10168.00000000 .00000086
00000-0 26408-4 0 07
2 36602 98.2810 355.1295 0041968 188.4465 281.1292
14.40904444 03
The pre-launch element set was:
PRISMA
prelaunch
1 99990
10166.62364178 .00001228 00000-0 40000-3 0 00000
2 99990
098.2728 353.7863 0044925 189.0849 345.1445 14.38254420000012
If we calculate the corresponding altitude
etc., we find the following:
Element
set
Perigee (km)
Apogee (km)
Nodal period (min)
Inclination (deg)
Pre-launch
733.6
797.8
100.180
98.2728
Onboard rev 6
727.0
786.9
99.995
98.2810
The pre-launch predicted osculating semi-major axis was 7147 km and the achieved semi-major axis was 7133 km, a slight under-performance of the launch vehicle. However, this small difference has no adverse effect at all on the mission.
The spectrum below was obtained from the Swedish Space
Corporation and shows the spectrum of
the signal on S-band from Prisma. The transmitter is phase-modulated with a modulation
index of 1.74 radians.
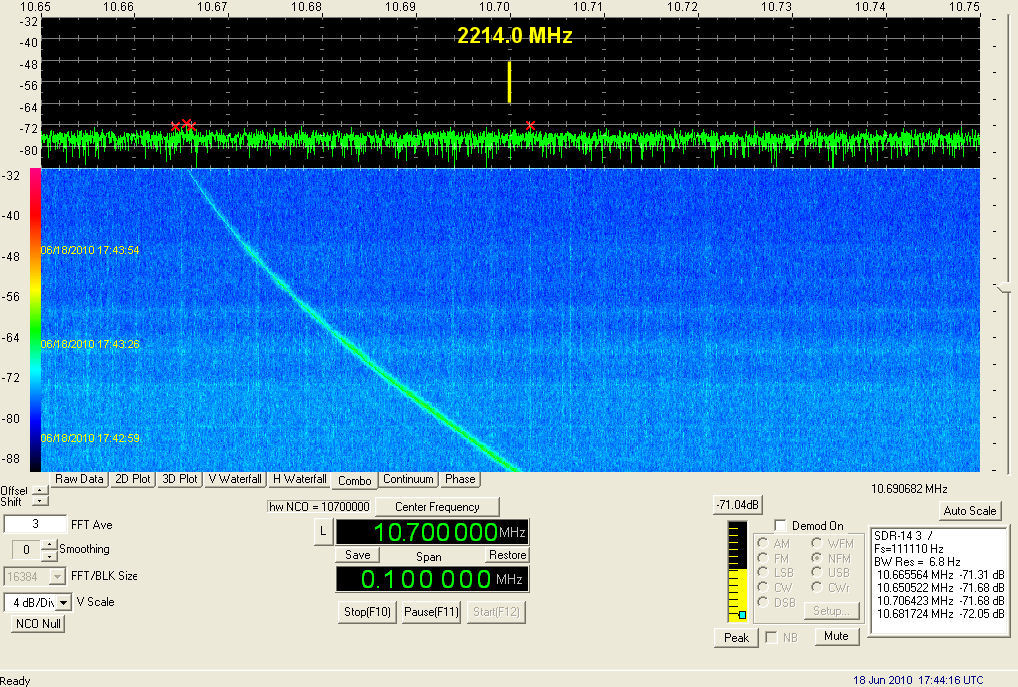
The waterfall spectra below were obtained during an overhead pass in Stockholm at 1739.03-1744.49 UT (closest approach 1742.48 UT). No longer present are the spectrum spikes 4 kHz apart. But a broad noise-like signal seems to be present in addition to the carrier. (The subcarriers at +/- 5kHz are artefacts generated by the receiver).
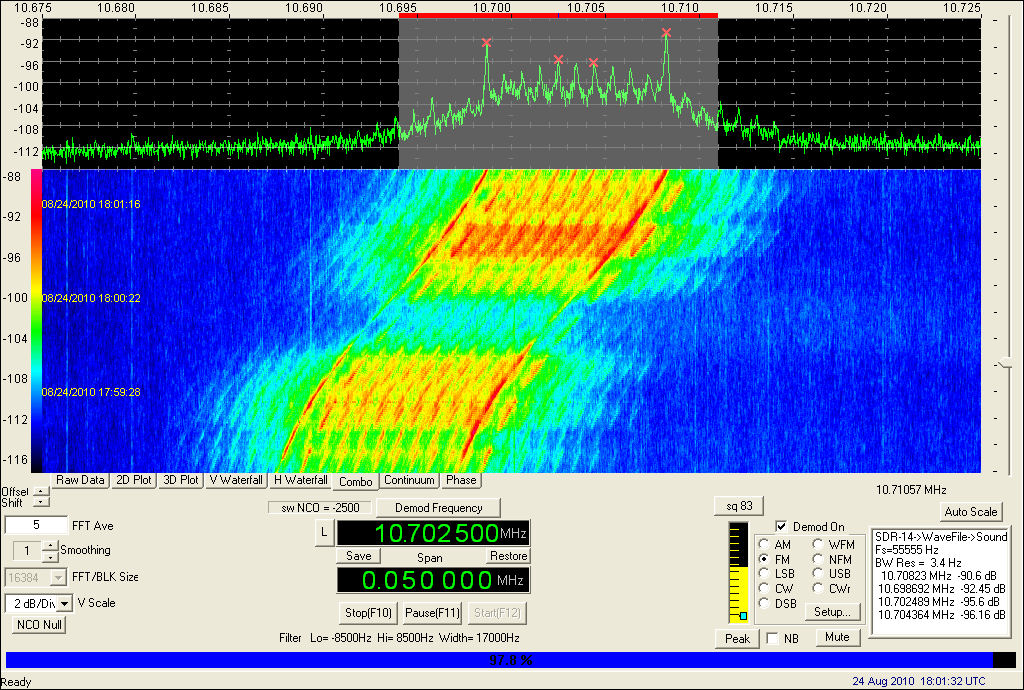
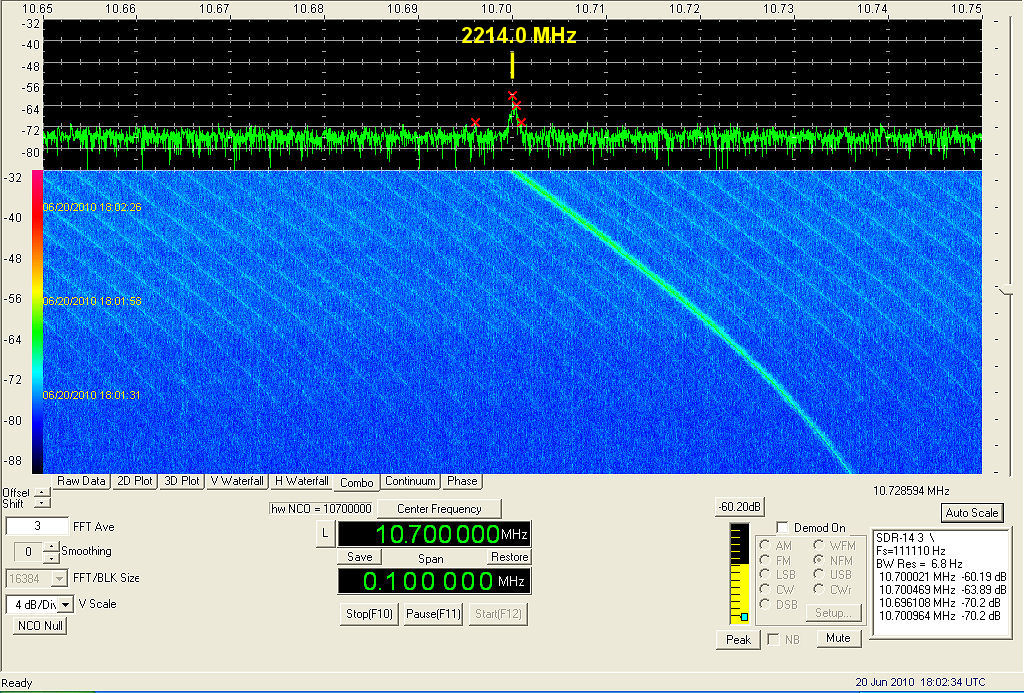
During the overhead pass at 1759.41-1807.20 UT the signal character was back to the situation where a 4 kHz raster of spectrum peaks can be seen. The spectrogram below was obtained at the moment of closest approach to Stockholm at 1802.34 UT.
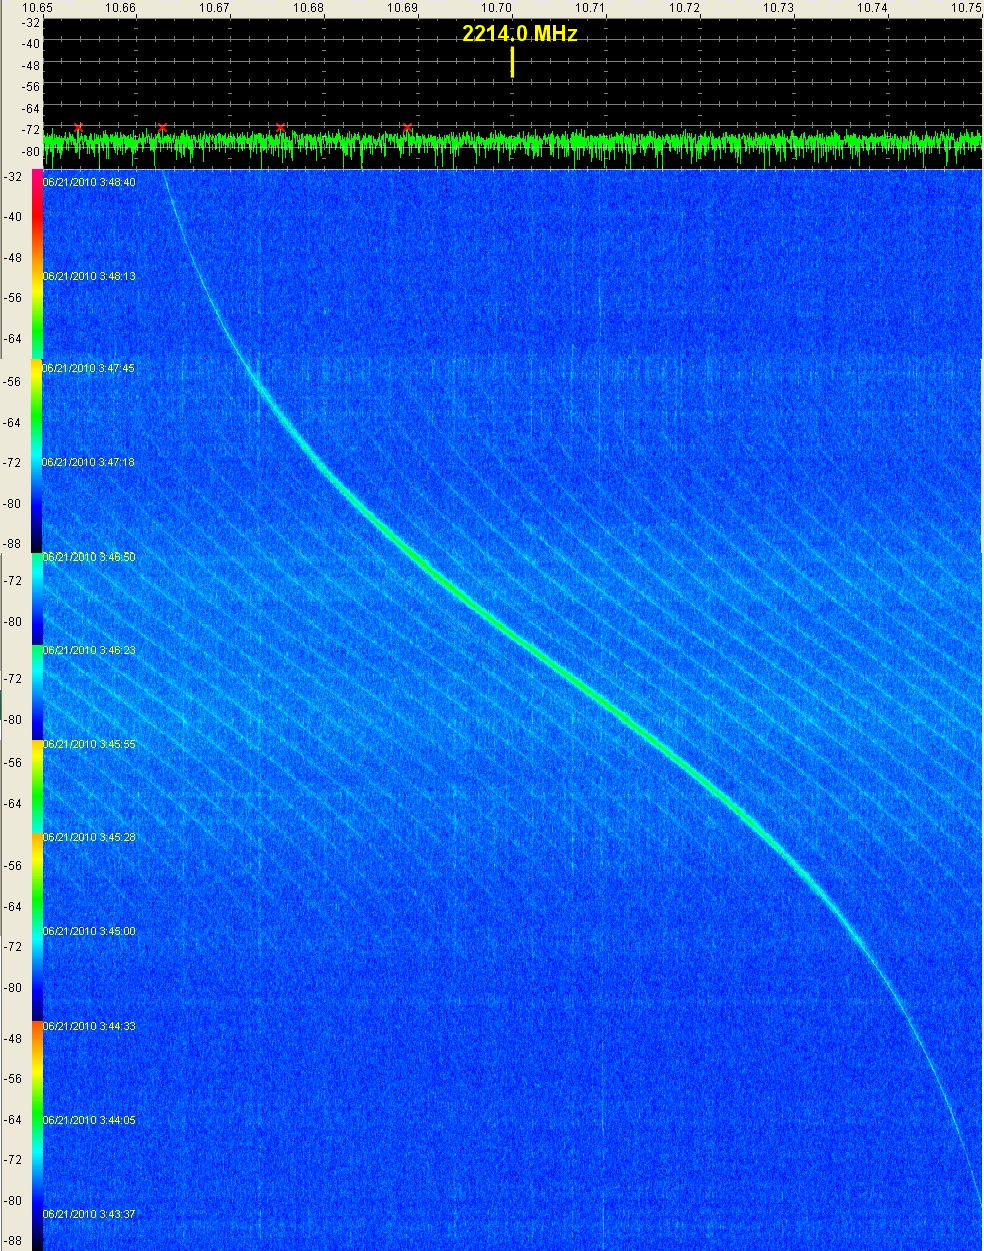
The waterfall spectrum below was put together by adding several short pieces of spectrum.
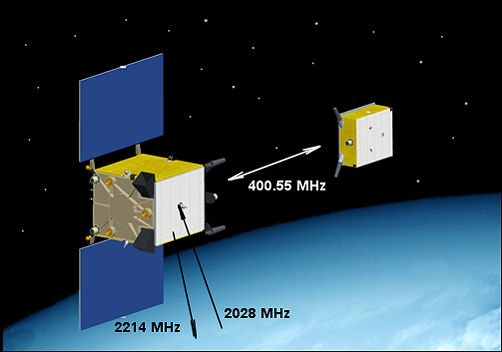
The signal between the two satellites is a a half-duplex link operating on 400.55 MHz with a 2 watt transmitter sending out FSK in a bandwidth of 30 kHz. The link is active even before the satellites have separated. The only link between the satellites is an RF link. Communications with the target satellite is done via the main satellite, see below:
In the normal mode the TARGET satellite sends three data blocks and the MAIN satellite transmits one datablock. Each data block is about 270 ms long. There is short interval (10 ms) between the transmission of data from the two satellites while the RF power of one transmitter drops off and the other ramps up. If the two satellites are not in contact with each other the MAIN spacecraft transmits a block every 11 seconds and the TARGET satellite sends three blocks every 4 seconds.
The target satellite (Tango) was separated from the main satellite (Mango) at 1751 UT on 11 August 2010. I tuned the ISL frequency at 400.55 MHz on the orbit before and the pass immediately following the separation event and was rewarded with strong signals at:
1636.55-1647.50
UT
1815.22-1827.17 UT
My Icom R20 scanner does not have enough FM bandwidth to properly demodulate the FSK from the two craft, but the basic signal structure with the longer data burts from the Target can easily be discerned when the receiver is in CW mode. The spectrogram below shows the basic link structure:
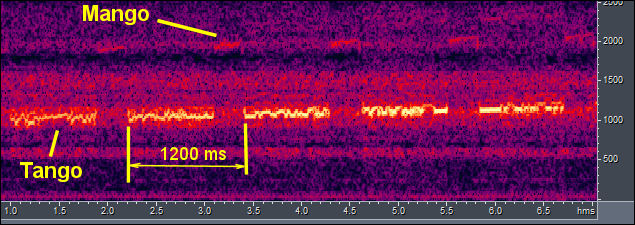
The signals from Mango and Tango consist of one and three data blocks repectively. The first block from each spacecraft starts with a "ramp-up" sequence and is a bit longer than the other blocks. The first blocks from each spacecraft are 280 bytes long (the transmitting/receiving circuit is a UART, so the byte length is 10 bits, i.e. including start/stop bit). The other blocks consist of 272 bytes. That means that the total number of bytes transmitted are 280+280+272+272=1104 bytes. The data from the onboard computer to the transmitting unit is sent at a rate of 8.55 ms per 8 byte. Therefore the blocks take 1104*8.55/8=1179.9 ms (say 1180 ms) to transmit. Then there are short transmission breaks at each changeover between the spacecraft. Thus the total time for a handshake cycle is 1180 + 10 + 10 = 1200 ms, just as is observed.
At 0531 UT on 13 August 2010, Richard Flagg in Honolulu tuned the ISL using his SDR-14 receiver and generated the waterfall spectrogram below near the closest approach to Honolulu of the two spacecraft. It is a classical FM spectrum and shows that the RF bandwidth is about 10 kHz. The Doppler shift can be clearly seen.
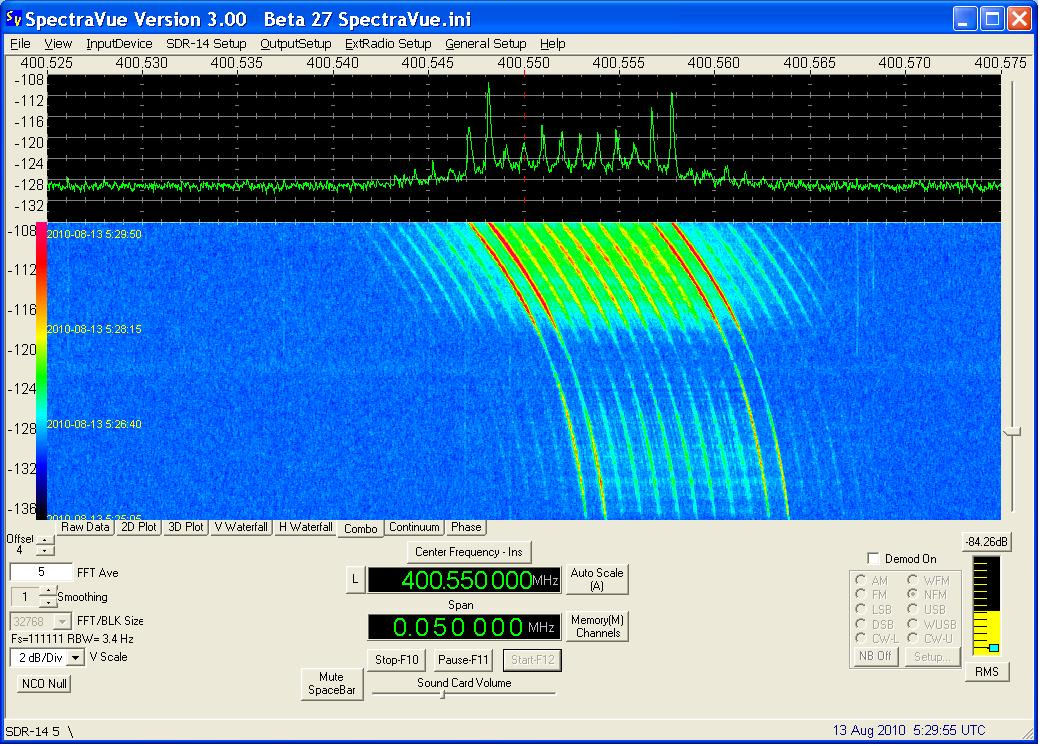
.
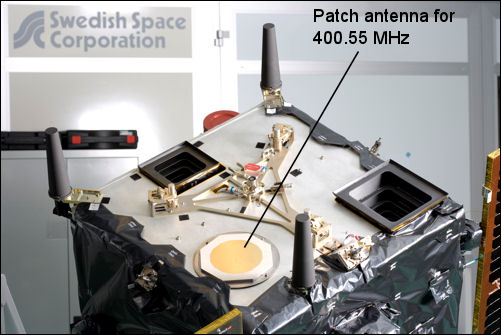
The patch antenna on the Mango satellite used for the inter-satellite link can be seen in the picture below:
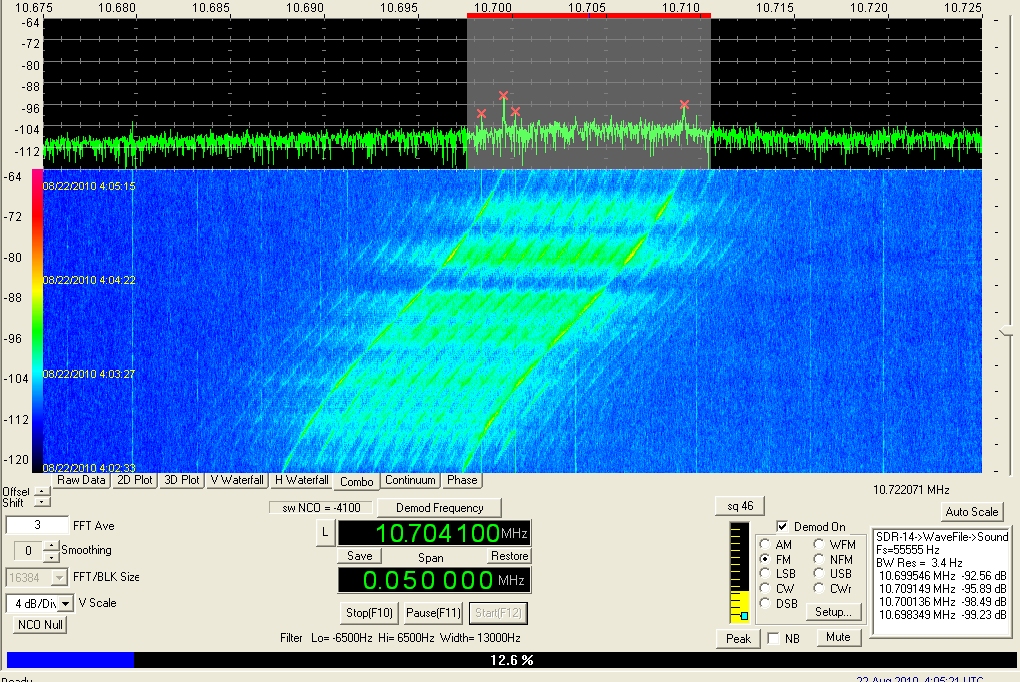
Below is a spectrogram of the inter-satellite link recorded in Sollentuna on 22 August 2010. The variations in signal strength are caused both by the discone reception antenna, polarization losses and the antenna patterns of the Prisma spacecraft. The doppler effect appears reversed, but this is because, at this frequency, the AR-8600 receiver inverts the intermediate frequency spectrum. The FM detector was activated on this near-overhead pass in the early hours of 22 August. A recording made at 0403 UT using a 12 kHz demodulator bandwidth can be found here.
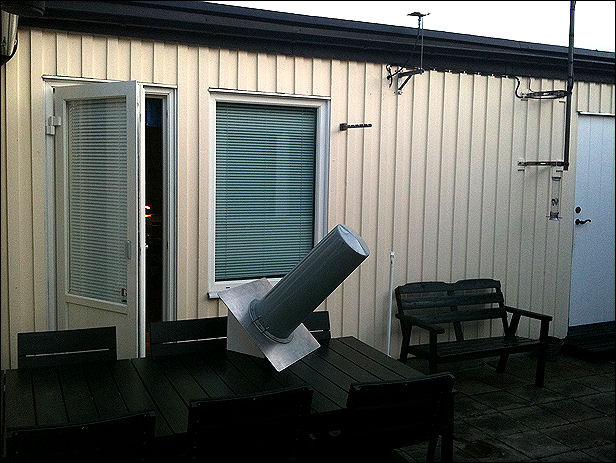
To improve signal level I brought into operation an old helix antenna previously used ion the Astrid-1 project. I aimed it at the culmination point of the two satellites. The picture below shows the set-up.
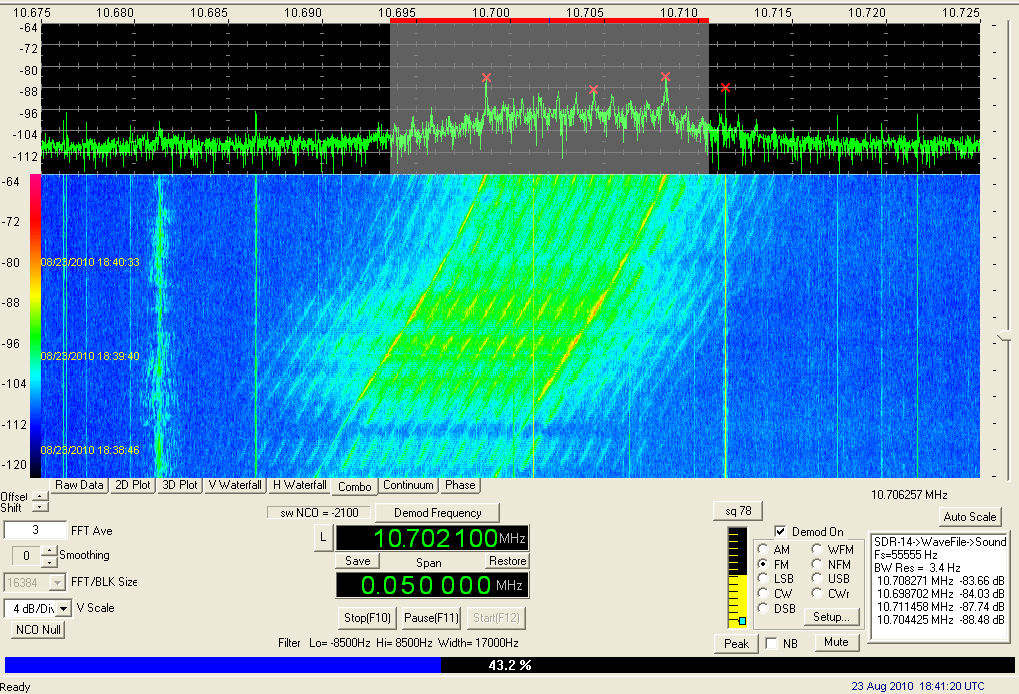
The waterfall spectrum of the pass is shown below. The FM demodulator (which I had set for 16 kHz bandwidth) is shown as a grey area with a red stripe at the top:
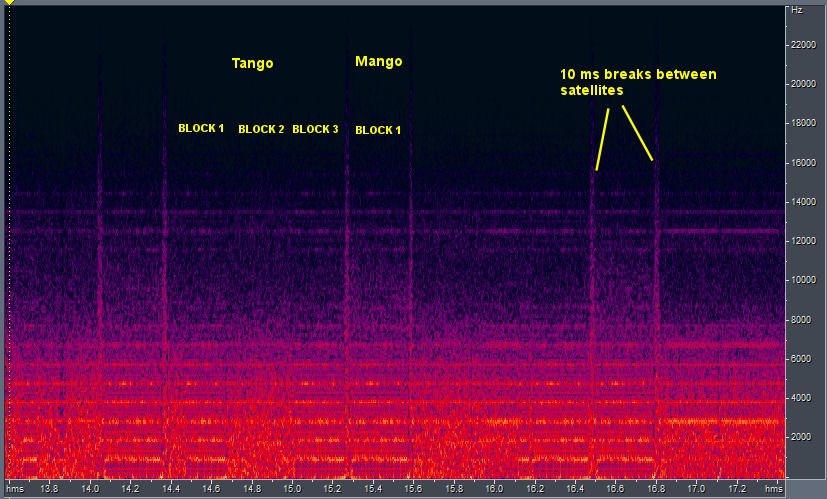
This time the signal level was such that it was possible to get a good demodulated signal. (Listen here). I ran this signal through the Adobe Audition software and obtained the audio spectrum below. The transmissions from both satellites are clearly seen and the three blocks from Tango can even be seen. The 10 ms silence between satellites is also clearly seen:
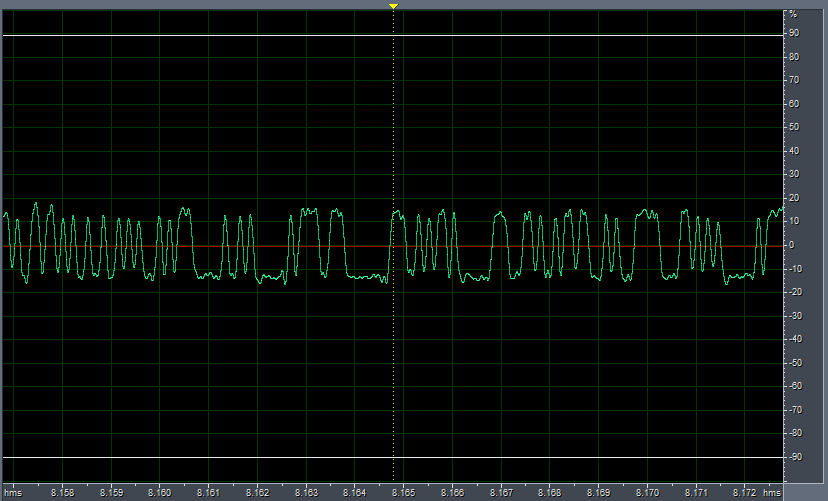
By zooming into the signal when displayed by Adobe Audition in the amplitude mode the binary signal is clearly visible below. This should be possible to read by a bit synchronizer? The horozontal scale is in milliseconds.
The waterfall spectrum below was recorded ona 75 degree elevation pass. Interestingly the signal was weak at closest approach.